Impact of air pollution of human health
Have you ever wondered what you are breathing in? It’s more than air! We know surprisingly little about the air that we breathe and how it impacts us. Ambient air pollution is one of the leading contributors to adverse health effects in humans. Epidemiological studies across the world have shed light on the ramifications of exposure to polluted air and even linked it to increased mortality and morbidity[1]–[4].The effects of poor ambient air quality are so conspicuous that WHO declared it as one of the single largest environmental risk factors[5]. While the short term effects include coughing, shortness of breath and COPD(Chronic Obstructive Pulmonary Disease), exposure over a long term could lead to asthma and even cardiovascular mortality[6]. According to WHO, about 3 million people die every year due to issues resulting from exposure to air pollution, of which 1 million are from India [7]. These effects have substantial economic impact too. A study suggests that Indians spend INR 139.45 billion on asthma treatments every year[8].The first step in mitigating the impact of poor air quality is to quantify it. Assessing the quantum of exposure to individuals would help policy makers and public in making informed decisions to combat air pollution and protect themselves.
Existing air quality monitoring infrastructure
What if someone were to ask you which the most polluted city in the country was? Most of you might already know the answer. In the worst case, a simple online search would throw the results in less than a second. However, what if you were asked to identify the locality with the worst air quality, or the best for that matter? What about the air quality in your own locality, your place of work or the along the route that you take to commute between these two locations? It is safe to say that this information is non-existent at present. The primary reason for which is the existing air quality monitoring paradigm. Air quality, at present, is measured primarily for checking compliance to national standard or for scientific research. In order to do so, monitoring stations with sophisticated instruments are installed at various locations. However, these stations are sparsely distributed across a city and thus are capable of covering a very small part of the city. At present, there are 232 such Continuous Ambient Air Quality Monitoring Stations (CAAQMS) spread over 129 cities in India. Only a handful of these cities have more than one station. Owing to sparsity of measurements sites, only city level estimates of air pollution, reported in terms of Air Quality Index, are available.
Limitations of state of the art
Air quality varies drastically across locations and through different times of the day. Fixed site monitoring stations are capable of providing precise concentrations of pollutants in the air however, they are unable to capture variations in space and time. This leaves large pockets of the city where the ambient air quality is unknown. Chennai, which is spread over roughly 426 km2 has only three CAAQM stations as shown in Figure 1. An obvious solution would be to expand the ambient air quality monitoring network. Increasing the density of these fixed site monitoring stations would help obtain measurements from more locations. However, such expansions are prohibitively expensive. According to a news article last year, Tamil Nadu state was in the process of expanding its air quality monitoring network at a cost of INR 39 crores. It involved setting up 23 fixed site monitoring stations spread across 13 towns and cities, at a cost of roughly INR 1.5 crores per station[9]. In addition, each station adds an operational cost of INR 12-15 lakhs annually.
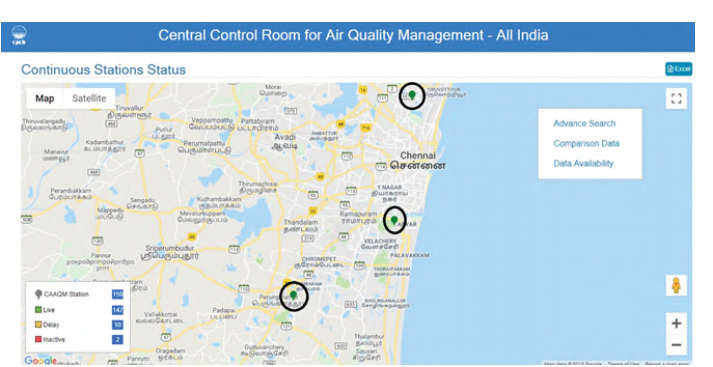
Figure 1: Fixed site CAAQMS stations across Chennai city
Solution – Hyperlocal air quality estimation using low cost mobile sensing
The need of the hour is to identify a means of expanding the monitoring network at minimal cost. This is where low cost sensor alternates could play a major role. Recent technological advancements have introduced low cost sensors that are capable of measuring almost all the major criteria air pollutants. Unlike large conventional air quality monitoring equipment, these sensors have a very low form factor. However, the only downside to these sensors is their fidelity. Researchers across the globe are aiming at validating the accuracy and feasibility of these low-cost sensors. These sensors are capable of measuring only a few meters from where they are deployed. One would require an extremely large number of these sensors to cover a single city, if they are deployed in a static fashion. However, if these sensors could be moved from one location to another, the number of sensor nodes required could be brought down drastically. This would usher in a paradigm shift in the way air quality is measured; using mobile monitoring. Mounting these sensors on vehicles would allow them to cover a significantly larger area with just a fraction of the nodes as would be required in static monitoring. The existing vehicular infrastructure could be used as a vector for these sensors. Consider a couple of hundreds of such mobile sensor nodes crisscrossing an entire city, measuring air quality along the path that they take, thus enabling the acquisition of air quality information that is variant in both space and time at unprecedented granularity.
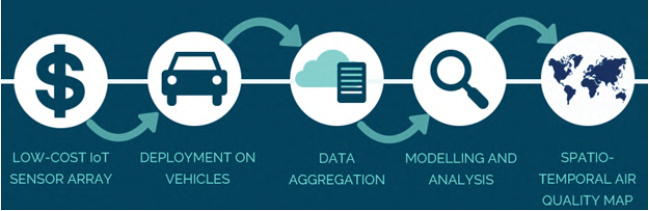
The mobile monitoring paradigm carries its own set of challenges. In a purely mobile monitoring paradigm, the temporal resolution is traded off for a higher spatial resolution. In order to overcome this limitation, a combination of static and mobile monitoring paradigm should be considered. The next challenge is in the aggregation of such large data sets and assimilation them to extract meaningful information. Big data and data science approaches play a significant role in solving the above issue. The sheer volume, velocity and variety of data obtained from the sensor network necessitates the need for a big data framework. Once the data is aggregated, a variety of data science tools would be needed to make sense of the data and generate insights. Figure 2 shows the schematic for hyperlocal air quality assessment using low cost sensor based mobile monitoring paradigm. Although it may not match the quality of information provided by regulatory networks, mobile monitoring networks are more than capable of providing relative information which could find use.
Some applications of hyperlocal air quality information are as follows:
-
Creating awareness: The information could be used to educate the public about the air quality across the city and help in creating awareness
-
Augmenting existing sensor network: The hyperlocal information available could be used in addition to the regulatory fixed site monitors to fill gaps in the air quality information.
-
Identifying spatio-temporal hotspots and characterizing them: Ambient air quality is a dynamic entity that varies drastically in both, space and time. There exist locations across a city that have varying concentrations of pollutants at different times. The objective here is to identify such hotspots of pollution and develop a map of the same. Simple algorithms would allow us to rank these hotspots from severe to benign and thus enable the development of customized solutions for social and commercial impact.
-
Aiding city planning and policy making: This information could be used in pinpointing sources of air pollution and could inform policy makers and city planning commission of changes that would help keep air pollution and its impacts under check
-
Assessing personal exposure: Given hyperlocal air quality information is available, the next step is estimate exposure to individuals. This would also aid epidemiological studies which aim at understanding the effect on air pollution on human health.
-
Identifying safest routes: Given two locations in a city, there would always exist one route which is relatively cleaner than the other alternates. Just like google is able to predict the quickest route between two locations, use of hyperlocal air quality information would allow people to choose the safest route from one location to another in which there is least exposure.
The area of low-cost sensing for air quality estimation itself is still in a nascent stage. However, with improvement in sensor technology combined with specialized algorithms and data science tools, low cost sensor based mobile monitoring paradigm has the potential to completely overhaul fixed site monitoring and become the norm for air quality assessment across the globe.
References:
-
J. Lelieveld, J. S. Evans, M. Fnais, D. Giannadaki, and A. Pozzer, “The contribution of outdoor air pollution sources to premature mortality on a global scale,” Nature, vol. 525, no. 7569, pp. 367–371, 2015.
-
I. Manisalidis, E. Stavropoulou, A. Stavropoulos, and E. Bezirtzoglou, “Environmental and Health Impacts of Air Pollution: A Review,” Front. public Heal., vol. 8, p. 14, Feb. 2020.
-
K. Balakrishnan et al., “The impact of air pollution on deaths, disease burden, and life expectancy across the states of India: the Global Burden of Disease Study 2017,” Lancet Planet. Heal., vol. 3, no. 1, pp. e26–e39, Jan. 2019.
-
J. S. Apte, J. D. Marshall, A. J. Cohen, and M. Brauer, “Addressing Global Mortality from Ambient PM2.5,” Environ. Sci. Technol., vol. 49, no. 13, pp. 8057–8066, Jul. 2015.
-
WHO, “Methods for burden of disease attributable to ambient air pollution for the year 2012,” Geneva, 2014.
-
J. Li et al., “Long-Term Effects of High Exposure to Ambient Fine Particulate Matter on Coronary Heart Disease Incidence: A Population-Based Chinese Cohort Study,” Environ. Sci. Technol., vol. 54, no. 11, pp. 6812–6821, Jun. 2020.
-
WHO, “Ambient air pollution: A global assessment of exposure and burden of disease,” 2016.
-
S. S. Salvi et al., “Asthma Insights and Management in India: Lessons Learnt from the Asia Pacific - Asthma Insights and Management (AP-AIM) Study.,” J. Assoc. Physicians India, vol. 63, no. 9, pp. 36–43, Sep. 2015.
-
D. H. Ramakrishnan, “State’s air quality monitoring network to be expanded soon,” The Hindu, Chennai, 06-Jun-2019.
Ideas presented in this blog were generated as a part of project Kaatru. Kaatru (Tamil word for “Air”), is a project initiated under SENAI group at IIT Madras. The objective of project Kaatru is to leverage Big Data Analytics, Data Science, Artificial Intelligence and IoT to provide hyperlocal environmental insights and develop solutions for social and commercial impact. Kaatru was one of the top 25 teams out of 900+ teams in the second edition of Carbon Zero Challenge(CZC), 2019 a green innovation challenge. As one of the finalists of CZC 2019, Kaatru received prototype funding to showcase a proof of concept.
About the author:

Sathish obtained his bachelor’s degree in electronics and instrumentation from Anna University. Sathish worked as Instrumentation Engineer at Gyan Data Pvt. Ltd for a year and half, after which he went on to pursue his PhD at IIT Madras.
Sathish Swaminathan is currently a final year PhD scholar in the Department of Chemical Engineering at IIT Madras. Sathish leads project Kaatru under the SENAI group (Systems Engineering of the Natural and Artificial @ IIT Madras). His area of research is hyperlocal environmental monitoring using data science and IoT. His areas of interest include, energy management, Internet of Things(IoT), data science and process control.
 AI /ML Training
 Cross Domain Consultancy
 Product Development