
What is data science?
Data science is a concept that unifies statistics, data analysis, machine learning and domain knowledge in order to understand some phenomena with the data, extract knowledge and insights from structured and unstructured data.
What kind of thinking is required for data science?
Data science being inter-disciplinary requires both breadth and depth of thinking.
As part of any data science course, you will learn to build models using different ML techniques and use fancy visualizations, but it is a means to an end not an end by itself.
The purpose is to be able to solve problems and to have insights about what the data is telling us and connecting it to the business proposition that it offers your company/client.
Mindset and role of data scientist
Just like a professional engineer, your role as a data-scientist in the corporate world is to stay true to the goal of solving a problem for your customer, and you should wear your stakeholder’s hat every so often throughout your project lifecycle. This is the mindset required of a data scientist. You may find connections across the data that could be of academic interest but unless one can derive a business proposition for the client out of it, it is best parked for later explorations.
The roles of a data scientist:
- Formulation of problem statement
- Analyzing and presenting data
- Modelling the data
- Presenting the finding
The data scientist plays a key role in
Formulation of problem statement from the needs of a customer.
Problem statement and needs are engineering design terminologies. Need is the raw statements that the customers make. For example, suppose that a customer says "I want a device that can monitor my health status continuously". This statement is "raw" in the sense that it does not detail
- what health status does the customer want monitored?
- what does s/he mean by continuously? Is it like ICU patients, or, intermittently?
- why does the customer want this device? Is it to monitor during travelling, or, being at home? [the size of the equipment and the power storage would depend on these].
So, in engineering, we say, engineers have to ask these questions to clarify the need from the customer and formulate them as problem statements such that it can be addressed by an engineer.
What does one need to know for clarifying?
Let us take an example. A earphone manufacturer comes to you (a data scientist) and says "I want to improve sound experience of my customers". As a data scientist, you need to think "What does it mean to say sound experience", "What does it mean to say improve the sound experience". In other words, you are trying to break the statement into variables that can be measured/calculated/monitored, based on which you can make suggestions. You will also go on to ask, "What affects the sound experience"? In such a case, you are trying to identify variables that impact a process. So, a data scientist, always thinks in terms of measurable variables to formulate problems. This also requires the ability to quickly gain a broad understanding of a domain area. A good way to gain this ability is to read widely.
What will our measure of success be? This can be a tricky question
Example: If your goal is to bring a recommender system, how will you find out if the output of the new recommender system is “better” than the old system.
If you run it on historical data and show recommendations, do they have a expected result against which our result will be validated.
Let’s say you are building an AI system to check if your electronic chip is defective and classify it as good and bad. What testing methods will your chips be subjected to, to validate our results? It could be that you were asked to predict chip quality using parameters x and y but client would be testing it using parameter z. In this case, you should bring it to the clients notice and this may even result in rewriting the problem statement to weigh in parameter z. So, this important question of how the client will test what you develop sometimes helps uncover the gap between the problem statement and the customer need And establish acceptable sign off criteria for both the client and yourself.
Then there is the question of data availability. It is possible that crucial data you seek is not even available and you have to think of ways to reframe the problem or pose the right questions which will help you with the further feature selection.
To summarize, the combination of asking the right questions and selecting the right features to model the data, is crucial for problem formulation which in turn bringing in goal clarity.
Analyzing and presenting the data
In this role, a data scientist is usually presented with a dataset and is asked to identify useful information from it. Such information may be used to
- diagnose faults
- improve existing systems or
- predict trends
In any case, the first and foremost job is to understand the variables in the given dataset and then look into the values adopted by the variables. These will, in some cases, provide insight. For instance, if natural hair colour of humans is a variable, and you find "violet" as one of the values of the variables, you immediately know that there is something wrong. You know from your prior knowledge that natural human hair colour is never violet. In other words, you are drawing upon the idea of limits of variability for a variable to diagnose mistakes in the data. So, a data scientist always strives to understand the limits of variability for a variable in any given domain.
After you have taken a first-hand look at the variables and their values, the next aspect to look in a dataset is the sample size and sample representativeness.
Let us take some examples
Sample size, sample representativeness:
Let us take an example of this fictional statement printed in a business magazine
“The average income of an engineer, class of 2000, from one premier engineering institute x is Rs 50 lakhs per annum”.
Our immediate reaction is that if we join this institute we are settled for life. Let us try digging deeper. What questions will you ask to verify your understanding of the statistic thrown at you?
If you are like most people, you would have assumed that 50 lakh was arrived at by summing up the salaries of all those who graduate in the year 2000 and diving it by the total number of students who graduated i.e., the taking the MEAN. So in order to verify you ask the researcher following questions
- How many people from the graduating class took your survey?
Graduating class had 100 people and we surveyed 20 of them.
So that’s your first alarm – the sample size is not impressive.
- How did you get the contact all the engineers?
Response: we went to a college reunion and gave them the survey to answer after dinner.
That your second alarm: How do you know your engineer is giving you the actual salary? People are known to exaggerate their incomes due to vanity or even optimism (everything seems optimistic especially if you have had wine along with your dinner). So, is your data real (veracity of data)?
Also, are the 20 people who came for the reunion representative of the sample of engineers from that class? Let us say they were contacted via influencers of the class who are active in industry and come for college placements. And the influencers spread it via word of mouth with their friends and say Linkedin. Now, your sample consists of those who went on to work in the industry and do well for themselves. Typically, those who don’t consider themselves successful may not even turn up for such reunions.
So, our sample may very well have a selection bias.
And finally, let us say that out of the 20 people who turned up, one is CEO of a large company and is an outlier because her yearly income is 2 crore. This would boost your total income and thus skew your mean and give a misleading number. In such cases we may remove the outlier from our sample or use even consider choosing median as the appropriate measure of average.
So we saw that
- sample size has to be sufficient
- sample has to be representative of the population
- check for selection bias in your sample
- question the veracity of your data
- look for outliers that skew your data
Now suppose that the sample size was sufficient, and your sample was representative, and your data was true. And let’s say our client wants to know if admitting her ward in this prestigious college will ensure she will earn a handsome salary on graduating. So the question here is, is the relation between getting into this institutional and getting a financial good placement correlational or causational?
What do we mean by correlation and causation?
Correlation
Correlation is the systematic relation between two variables x and y such that if know x, I can predict y reasonably well. Take the following example: What we see is that over the years the number of civil engineering doctorates increased and the number of per capita consumption of mozzarella cheese also increased. They vary together (as one variable increases, the other also increases. As one decreases, the other also decreases).
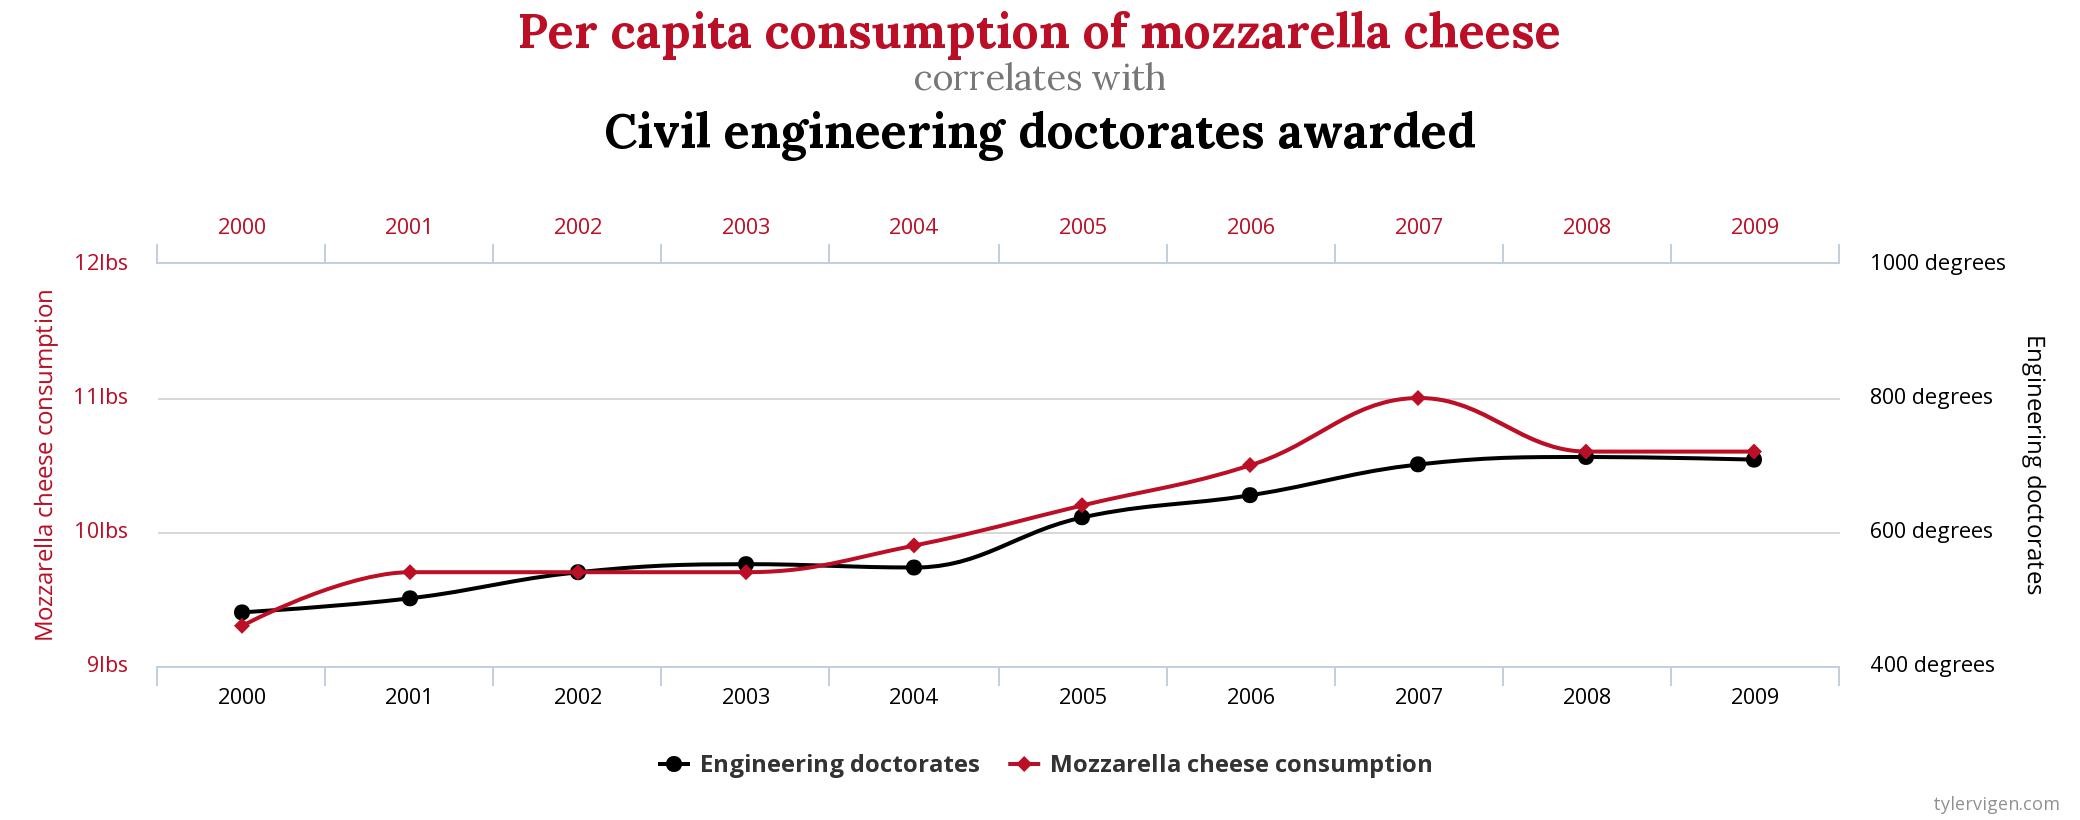
[Taken from https://www.tylervigen.com/spurious-correlations ]
Obviously, one didn’t cause the other. But the two variables are correlated as per our definition of correlation. Now why does it sound absurd? Because our human mind is unable to explain the relationship. We call these spurious correlations.
Let’s take another example:
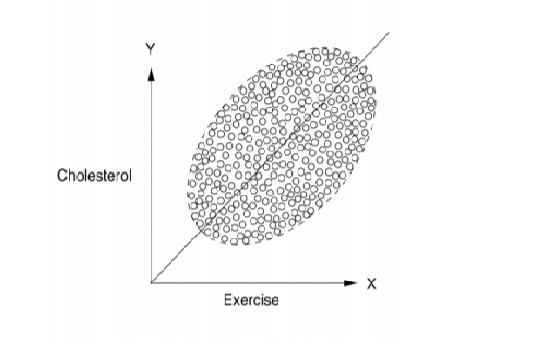
X-axis is number of hours spent in exercise, Y-axis is cholesterol levels
[Taken from ‘Book of Why’ by Judea Pearle]
From the above, the greater the number of hours spent in exercises, the greater the cholesterol levels. Now this is counter-intuitive to our understanding of the world. Do we infer that exercise increases cholesterol levels? Can you think of how to make sense of this?
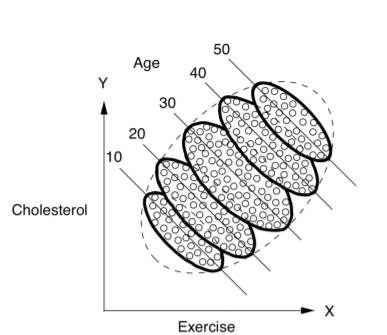
If we segregate the data by age, then we see that within a age group, increase in exercise, does indeed decrease the cholesterol.
In other words, we should look at the age-segregated data we conclude that the more you exercise , the lesser your cholesterol but if you view aggregated data, then you conclude that more hours of exercise increases cholesterol.
This is popularly known as Simpson’s paradox where your conclusion gets reversed when data is aggregated.
Why is it a paradox?
Racial disparity in the death penalty (source : Wikipedia)
This real-life example is taken from Radelet. The data are from twenty Florida counties during 1976-1977.
| Defendant Victim |
White |
Black |
| White | 13% (19/151) | 17% (11/63) |
| Black | 0% (0/9) | 6% (6/103) |
| Both | 12% (19/160) | 10% (17/166) |
Aggregating the data shows that white defendants are more likely to be sentenced to death penalty but segregating it by race of the victim, it appears that black defendants are more likely to be sentenced to the death penalty
Notice that if you remember properties of fraction addition in your middle school, you know that
If A/B > a/b and C/D > c/d, then it does NOT follow that (A + C)/(B + D) > (a + c)/(b + d).
So the result reversal itself is not that surprising. Lets call this Simpson’s reversal.
A paradox should entail a contradiction between two deeply held convictions. How can the justice system be more biased towards the white defendant and the black defendant simultaneously?
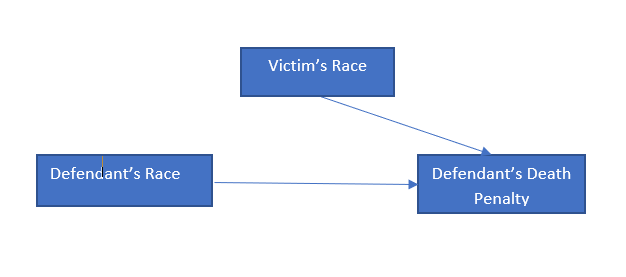
So ask the question “what story does my data tell?”. In segregating by racial profile of victims, it is clear that the conviction rates for crimes against white victims is much higher than for black victims. And more white defendants attack white victims which leads to aggregate showing larger bias towards white criminals. But in reality the bias is toward the black people – where they have lower conviction rates as victims, and if the defendant was black there was a indeed a bias is awarding death penalty.
| Defendant Victim | White | Black | Both |
| White | 13% (19/151) | 17% (11/63) | 14% (30/214) |
| Black | 0% (0/9) | 6% (6/103) | 5% (6/112) |
| Both | 12% (19/160) | 10% (17/166) |
In order to understand this, we can represent it as a causal diagram,
The Simpsons paradox is not all that uncommon.
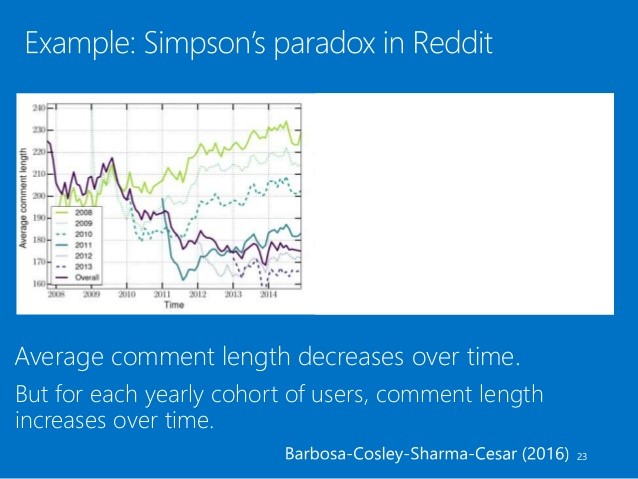
While studying user evolution in Reddit by the Microsoft research team, they found the trend of reducing length of user comments among reddit users over the years 2008-14. Before concluding this was a problem and working on trying to increase length of comments, they segregated the data by year only to see that for a particular year, the length of user comments increased over the year.
So the paradox here is the opposite conclusion of the data when aggregated and segregated. When delving more into segregated data, they realised that for each progressing year, the new users who signed up started with avg length of comments which was lesser than receding years, and although they showed a trend of increasing comment length the over length reduced year in year. They attribute this to a behavioural change in user communication over the years, more usage of acronyms and overall terser sentences.
On further drilling down to user profiles, they noted that activity long time users made longer comments than short lived users with low activity levels.
So this stopping to ask questions on why the data showed what it did, lead them to understanding their users betters and thus leading to more focused solution strategies.
[Taken from the http://www.amitsharma.in/ based on the research published in https://arxiv.org/abs/1603.07025]
Now you may ask, should I always segregate the data to make sense of it?
The answer is not always. In some cases, aggregation makes sense and in some case segregation makes sense. So how do we decide what to do? The answer lies in thinking causally, which is in fact, according to experts, what the human brain tends to naturally do.
For starters, look at the data generation process. A thumb rule would be, if there is a temporal precedence in data generation like treatment and drug effect then one should aggregate but in case of a lurking confounding variable (like age in the exercise-cholesterol case and racial profile of victims in the death penalty example) that explains the correlation, one should segregate. This is NOT fool-proof and one should pay attention to the causal structure of the story.
What do we mean by “Cause” and “Causality”?
It is indeed a philosophical question and first definition was given by Aristotle and till now remains a much-debated concept and it turns out we don’t have a unified definition of it that works across domains.
So, for the purpose of data science, a causal relation between x and y means X and Y have temporal relation where X precedes Y and X causes Y.
The word causes here can mean
Necessary causes
If x is a necessary cause of y,
If x then y,
Y occurs implies x occurred apriori
X occurs does not imply y will occur
Sufficient causes
If x is a sufficient cause of y,
Here
X occurs implies y will occur
Y occurs does not imply x occurred. There could be alternate variable z that caused y
Contributory causes
For some specific effect, in a singular case, a factor that is a contributory cause is one among several co-occurrent causes. It is implicit that all of them are contributory.
Need for Control and experimental group
Let’s take an example: Let us say a fertilizer company wants to test if its brand of fertilizers A gives better yield than generic fertilizer B. How should it conduct the experiments?
Let us say it tests A on a plot and B on another plot of same size and measures yield. Will that tell which is better?
First, we need to have a domain understanding of what factors affect the yield. Let’s say that temperature, rainfall, quality of water, soil fertility, microflora, etc are the other variables that affect yield. Then we need to control for all other factor keeping only fertilizer as the variable.
So the standard procedure is the split plot trial where a plot is split into two parts and one part is the control where fertilizer B is applied and another part is the experiment where fertilizer A is applied. This allows you to control for most of the listed variables.
So when establishing a relationship between X and Y we need to keep all other variables constant by controlling for them and having a control and experimental group is way of doing it. In scientific research we call this Randomized Control Trials.
Modelling the data
a. Choosing the right model
There are many ML models available. So how do we pick what works for this particular problem?
But first let me answer the question why you need a ML model. In our school and college books, we would have seen 2 D graphs which showed a function that modelled the relationship between two variables. In order for us to use this model, we had to assume all other independent variables related to the function remained constant. Now ML algorithms give you the power to model functions based on n number of variables or we can say it allows you to characterize multi-dimensional data. Each ML could differ based on how the variables change with respect to the dependent variable.
So this means when you are looking at data that you need to model, you make some assumptions about the data, based on the domain, your understanding of the data, distribution of the data or a combination of these. Then you pick a technique which has worked for problems based on same assumptions.
If the output make sense, then our assumptions are likely to be true.
If the output does not make sense, then modify assumptions and repeat the process.
Often times we assume that the problem is with the model and we try other models without questioning our assumptions. So rather than comparing models, you need to understand the assumptions that the models make to understand why they won’t/ don’t work for the data.
Now taking the case, where the results do make sense. Notice that we hanging by a lot of probabilistic words like "likely" to describe your assumptions.
We need to test our intuition by running the model through test data which is either unseen data or data set aside for purposes of testing. If the results here corroborate with the results we got with the initial analysis then we can say our model is now much more likely to model real world behaviour.
This is where testing plays a more critical role in data science vis a vis software engineering.
We also choose data models based on
(i)accuracy requirement (some non-linear models may give you greater accuracy over linear models)
(ii)performance requirement (linear models give you better performance over neural networks)
(iii) physics (we work with a lot of core engineering problems at Gyandata where the physics behind the engineering problem will dictate the best suited model)
(iv)complex problems (complexity of the problem statement may require combination of models to solve it in a layered manner or complexity of data like image processing could call for deep neural networks)
b. Ability to customize open source algorithms and
Similar to software engineers, a data scientist should be able to use open source algorithms, layer over them and even tweak them if needed as part of your solutioning process.
c. Cross validation of models
This is a set of validation methods that is different very unlike software testing
- Validation, train, test – for especially non-linear models, we separate the data into 3 sets for testing. We train the model on a set of data called training set, validate and fine tune it based on validation set data and finally run it on test data to verify if the model works.
- For linear data model, we often use k-fold
- We also use domain expert validation
Presenting the conclusion
When presenting the conclusion, one needs some creative visualization to be able to show the results in a manner that is easy for customer to make sense of and to take decisions on. Remember that the conclusion should answer the problem statements. So at all times, keep your goals on the what is defined at the onset, as it is easy to get carried away with results.
Conclusion: Thinking like a data scientist means
Getting an intuitive and conceptual understanding of what you are taught such that you can recognize and distil the problem statement from an unfamiliar problem and then apply what you have learnt.- Straddling between the methodology and the domain knowledge
- Critical thinking through the lifecycle of the project.
- Thinking in terms of variables, limits of variability, correlation, causation.
- Curiosity to learn as each problem could be from various domains and keeping up with the various ML algos that are created
- View the problem from multiple perspectives
- Develop a doubting and questioning mindset to be skeptical of the data, data collecting methods and your results and seek verification
- Systematically examining and evaluating evidence
- Valid and sound reasoning to arrive at conclusions
About the author:

Ms. Aarthi is an Electronic Engineer from PSG College of Technology and has an overall work experience of 16 years . She has worked with Infosys, TCS, iGate and Karix-Tanla primarily in J2EE technology across verticals like retail, logistics, pharmaceutical and Telecom. She has played many roles such as product developer, technical architect, project manager for both large and small companies in India and USA.
She wanted to step out of the comfort zone and explored her interest in contributing to education and went on to work for ThinQ [pronounced as Think], education research education group with the aim to help learners develop the critical thinking capacities and rational inquiry. She also spent a year designing Math curriculum and lessons for a small group of homeschooling children. Intrigued by AI and wanting to apply her critical thinking skills, she joined Gyan Data Pvt Ltd, an IIT incubated company, in 2019 and functions as a project manager for AI and ML solutions.
She is an avid reader with a wide variety of interests from philosophy to fiction to popular science. She is also an interpreter and translator of German; enjoys travel and high adrenaline activities such as sea diving, snorkeling and para sailing.
 AI /ML Training
 Cross Domain Consultancy
 Product Development